MBA 616: Information Systems Strategy and Management
The Purpose of this course is to expose students to topics in technology supported business decision making, re-engineering, and related management strategies. Also, topics relative to management support technologies, modeling and decision making techniques are a big part of this course. Throughout the course, us students had to work through various projects that taught us important skills about analyzing data and simplifying data in order to make more informed business decisions. A synopsis of the top 3 projects that I found the most helpful from this course can be seen below!
MBA 616 Projects
Tableau / GIS (Geographic Information Systems)
During the Module that this project took place in, we were able to learn about business reporting and visual analytics. we had a chance to learn about efficient visualization approaches, and particularly about geographical information systems.
The project for this module was using Tableau to visualize data about different car brands from 1971 through 1983. We chose to use Tableau because it is easy to learn and does an excellent job of being efficient and creating really good visuals. For the dashboard I created, I was interested in looking at how American cars performed in fuel efficiency compared to cars from Europe and Japan. The results were basically what you would have expected based on stereotypes of car brands and can be seen in my visualization in the screen shot on the right. Tableau was great for this exercise because it was able to take complex data that was difficult to comprehend in an excel spreadsheet and create these simple visuals that helped me better understand the data I was looking at!

Simile / System Dynamics
The module that this project was in was all about system dynamics simulation modeling. A great question that you might be asking yourself right now is "why do we perform system dynamics simulation modeling?". The answer to that would be so that we can take complex problems, such as personal financials, and simplify it into clean visuals that will help us to make more informed decisions.
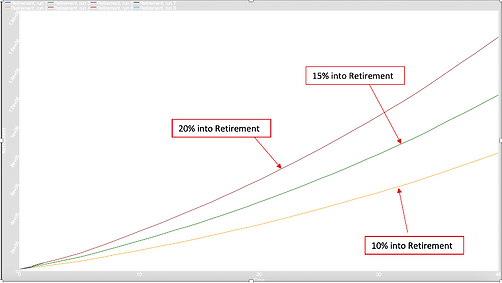
In this project, we were tasked with creating a model of our personal finances, or finances that we are interested in, and create visuals that will help us see what our results are. The model that I had made to the right was intended to help me understand what I need to save for retirement in order to reach my retirement savings goals. I ran a simulation where I save 10%, 15% and 20% of my income to see how much I could potentially have saved for each scenario. The graph to the right shows the results. The bottom line is saving 10%, middle line is saving 15% and the top line is saving 20%.
This project was awesome as it taught me how to use simile as a tool to understand complex problems such as cashflows. The program was able to create visualizations for me that allowed me to better understand a financial situation in order to make informed decisions.

SPSS Modeler
The purpose of the module that this project was in, was to teach us the importance of data mining and some of the data mining techniques that are available to us. One of those resources that we learn about was IBM SPSS Modeler. The purpose of IBM SPSS Modeler in the project for this module was to discover patterns in historical data that allow us to make predictions for future events that help us have better decision making for our business.
For the SPSS Modeler project, we had just inherited a coffee shop and wanted to look at the historical data to make predictions for how to best run the business going forward. The screen shot on the right is a picture of what my dashboard in IBM SPSS modeler looked like when evaluating the coffee shop data.
This project did a fantastic job at opening my eyes to the power of data mining and what data mining can help your business achieve. In every facet of our jobs, there is alot of data that is surrounding us, we just need to be able to dig up that data and put it into the correct softwares that will help us visualize our business in a simple way and help us better understand how to make decisions to grow the business.
